
What Is the Best Way to Monitor Slurry Pump Performance Remotely?
What Is the Best Way to Monitor Slurry Pump Performance Remotely?
What is the best way to monitor slurry pump performance remotely? For mining, mineral processing, and industrial operations, the most effective approach combines connected sensors, reliable data transmission, and actionable analytics. Tracking flow, pressure, vibration, temperature, and power consumption helps maintenance teams spot signs of abrasive wear, blockages, and cavitation before they lead to costly downtime. However, useful monitoring requires more than a dashboard—it needs operating baselines, well-configured alerts, and data that reflects changing slurry conditions.
The strongest setup connects pump condition with process performance. A vibration sensor may detect a developing mechanical problem, but it cannot tell you whether the pump is delivering the required slurry flow. Likewise, a pressure reading alone cannot distinguish impeller wear from a change in slurry density. The following guidance focuses mainly on centrifugal slurry pumps, where interpreting these signals together is particularly important.
Monitor the operating duty, not just the machine
Slurry is not a consistent fluid. Solids concentration, particle size, entrained air, and viscosity can change as upstream equipment or feed conditions change. A pump moving dilute slurry may behave differently from the same pump handling a denser mixture, even when its mechanical condition is unchanged.
This makes operating context essential. Record pump speed, sump level, relevant valve positions, and slurry density where practical. If density measurement is unavailable, use verified process information as supporting context and make that limitation visible. An analytics system should not interpret every change in motor load as wear.
Two questions should guide the monitoring design: Is the pump meeting its required duty, and is its condition deteriorating while doing so? The first needs hydraulic and process measurements. The second needs mechanical measurements and maintenance history. Neither view is sufficient by itself.
Which measurements deserve priority?
Flow, pressure, and speed establish hydraulic performance
Measure flow and both suction and discharge pressure where feasible. Discharge pressure alone does not establish the pressure rise across the pump. Sensor elevations and pipe velocities may also matter when calculating total head, particularly when comparing field performance with a pump curve.
For conductive slurries, a magnetic flowmeter is often worth considering because it has no obstruction in the measuring bore. Selection still depends on conductivity, liner and electrode compatibility, abrasion, installation geometry, and whether the pipe remains full. Clamp-on ultrasonic measurement can simplify installation, but solids and entrained air may affect signal quality; suitability should be demonstrated under actual process conditions.
Pressure instruments need equal attention. Abrasive slurry can damage wetted components, while narrow impulse lines may plug. Flush-mounted diaphragms or suitable isolation arrangements can help, provided their materials, response, and maintenance requirements match the service. A stable-looking reading from a blocked connection is worse than an obvious instrument fault.
Vibration and temperature reveal mechanical changes
Bearing-housing vibration can indicate imbalance, looseness, misalignment, or bearing deterioration. Consistent mounting and measurement direction matter: changing the sensor location can change the signal without any change in pump health. Overall vibration is useful for screening, but frequency spectra and waveform data provide better diagnostic evidence when investigating an alarm.
Bearing temperature provides another reference, especially when considered alongside load, speed, lubrication condition, and ambient temperature. A rising temperature is a reason to investigate, not a diagnosis. Depending on the pump design, seal-water pressure or flow may also deserve monitoring because losing that service can create a problem before the main process readings change.
Power helps explain load, but needs context
Use measured electrical power or suitable drive data rather than treating motor current as an exact substitute. Current is influenced by electrical operating conditions, and drive estimates have their own limitations. Electrical input power also includes motor and drive losses, so it is not the same as pump shaft power.
Combining flow, head, density, and power can reveal performance trends. Absolute efficiency estimates require greater care: uncertain density, inaccurate instruments, and unaccounted losses can make a precise-looking calculation misleading.
Build a data path that survives plant conditions
A practical architecture usually connects instruments to a PLC or local acquisition device, then passes selected data through an industrial gateway to a historian or remote analytics platform. Existing control-system measurements should be evaluated before adding duplicate sensors.
Wired connections often make sense near fixed equipment where power and cable routes already exist. Wireless sensors can be useful for difficult retrofit locations, but radio coverage, metal structures, enclosure suitability, battery life, and access for servicing must be checked. The right choice depends more on installation constraints than on whether the technology is newer.
Do not confuse dashboard refresh rate with measurement capability. Slowly changing process values may need only modest reporting rates, while vibration diagnostics require much faster local acquisition. An edge device can collect waveforms, calculate condition indicators, and transmit summaries while retaining detailed data for investigation.
Local buffering should preserve timestamped records during communication outages. The display should clearly identify stale readings, missing data, and sensor faults. Otherwise, a frozen value can look reassuring precisely when visibility has been lost.
Remote visibility must not compromise plant control. Segment operational networks, restrict permissions, and use authenticated access through an approved architecture. Protective interlocks should remain local and independent of internet availability. Monitoring access should not automatically grant permission to change pump settings.
Establish baselines before asking software to detect faults
Start with verified instrument readings and a pump whose condition is reasonably understood. Capture normal operation across the duties that actually occur, including different speeds, feed conditions, and sump levels. A baseline taken at one convenient operating point is unlikely to represent the whole process.
For variable-speed pumps, compare similar operating states or apply appropriate normalization. Pump affinity relationships can support interpretation, but slurry properties and system behavior limit how confidently simple scaling can be used. Manufacturer performance information and slurry corrections should inform comparisons where applicable.
Keep maintenance events in the same timeline as operating data. Impeller replacement, clearance adjustment, bearing work, and sensor replacement can all change the baseline. Without those records, software may label a successful repair as an anomaly—or absorb a deteriorating condition into its definition of normal.
Turn signal combinations into useful investigations
Remote monitoring is most useful when it narrows the next inspection rather than claiming certainty. Several patterns deserve attention, but none should be treated as proof on its own:
- Falling flow and head at comparable speed and slurry conditions: investigate hydraulic wear, changing clearances, air ingress, or suction restrictions. Check instrument health before attributing the trend to the pump.
- Reduced flow with increasing discharge pressure: inspect downstream restrictions and valve status. The pattern depends on the pump and system curves; it is not a universal blockage signature.
- Unstable pressure with increased vibration and a low sump level: examine suction conditions, vortexing, and air entrainment. Cavitation assessment also requires consideration of available suction head and the pump’s requirements.
- Increasing bearing temperature with changing vibration: investigate lubrication, alignment, loading, and bearing condition. Spectral data and a physical inspection may be needed to distinguish causes.
Separate equipment protection limits from diagnostic alerts. Protection limits should follow the equipment design and approved operating requirements. Diagnostic alerts can use deviations from baseline, persistence periods, and combinations of signals to reduce nuisance notifications during starts, stops, and planned duty changes.
Every actionable alert needs an owner and a response. “High vibration” is incomplete. A useful notification identifies the pump, operating state, trend, supporting measurements, and recommended checks. It should also distinguish a condition that needs immediate operator attention from one suitable for planned maintenance review.
Choose the platform around maintenance decisions
An existing plant historian may already support process trending and basic alerts. A dedicated condition-monitoring platform becomes more valuable when teams need vibration analysis, fleet comparisons, or structured diagnostic workflows. Cloud deployment can support access across sites, while on-premises deployment may better suit particular connectivity or security requirements. Neither is automatically superior.
Before selecting a system, ask to see how it handles raw-data export, timestamp alignment, missing readings, alarm acknowledgement, and maintenance annotations. Confirm who owns the data, what happens if a subscription ends, and whether detailed vibration records remain accessible. These issues often matter more over the equipment’s life than dashboard appearance.
Be cautious with claims of remaining useful life. Slurry wear depends on changing material and operating conditions. A prediction without representative history, confirmed failure modes, and stated uncertainty can create false confidence. Transparent trend analysis is often a better starting point than an unexplained failure date.
Start with one pump and test the complete workflow
A sensible first installation targets a pump whose failure disrupts production and whose duty can be characterized. Verify sensor installation, establish representative baselines, and test communication loss and alert delivery. Then check whether a maintenance technician can use the information to decide what to inspect—not merely whether the dashboard receives data.
Before expanding, document the required measurements, environmental conditions, connectivity, inspection responsibilities, and integration with maintenance records. The best remote monitoring system is the one that reliably separates process changes from equipment deterioration and makes the next action clear. More sensors are justified only when they resolve a meaningful blind spot.
Related Information
 Oct 24, 2026
How Much Should a Froth Pump Be Oversized for Flotation Concentrate?
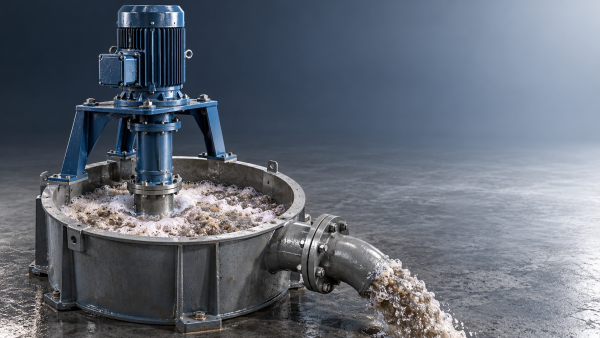
How much should a froth pump be oversized for flotation concentrate? Learn how inlet air, peak flow, and head affect sizing to avoid costly mistakes and select the right pump.- Oct 24, 2026
Is Higher Hardness Always Better for High-Chrome Pump Castings?
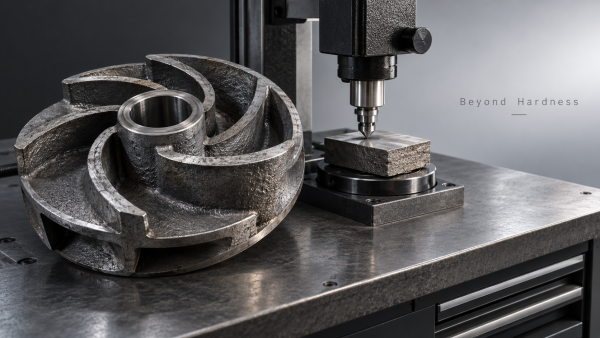
Is higher hardness always better for high chrome pump castings? Discover how toughness, carbide structure, and slurry conditions affect service life—and choose smarter to reduce downtime. - Oct 23, 2026
Which Leakage Test Should You Specify for a Zero-Leakage Knife Gate Valve?
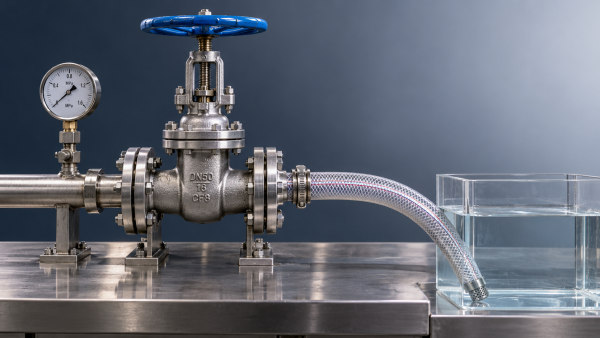
Which leakage test should I specify when ordering a zero-leakage knife gate valve? Compare API 598 and ISO 5208, define seat leakage limits, and avoid costly purchasing mistakes. - Oct 23, 2026
Which Pump Material Lasts Longest in Limestone-Gypsum FGD Slurry?
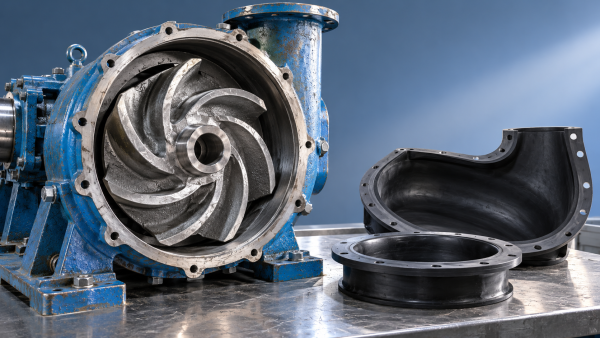
Which pump material lasts longer in limestone-gypsum desulfurization slurry? Compare high-chrome iron, rubber and duplex steel to find the right fit, reduce downtime and extend service life.

{item.title}
Get a Quote
Please leave your information and email address, and we will contact you as soon as possible.