
Pump CFD Analysis: Identifying Recirculation and Erosion-Prone Zones
Pump CFD Analysis: Identifying Recirculation and Erosion-Prone Zones
Internal recirculation and localized erosion can compromise pump efficiency, reliability, and service life, yet neither is easy to assess from performance curves alone. A pump may deliver the required head while reverse flow develops near the impeller eye or solids repeatedly strike a small section of the casing. The overall duty point does not reveal where these problems begin.
Pump CFD Analysis helps expose those internal conditions. Its value, however, depends on more than producing velocity contours. Operating points, clearances, particle properties, and numerical assumptions determine whether the simulation identifies a credible concern or merely a visually striking feature. For technical evaluation, the useful question is not “Where is the flow red?” but “What mechanism creates this hotspot, and what evidence supports it?”
Start with the operating envelope, not one duty point
For a centrifugal pump, an analysis performed only near the best efficiency point can miss conditions responsible for field damage. Low-flow operation changes blade incidence and can produce inlet recirculation, passage separation, and stronger internal mixing. At high flow, unfavorable incidence and increased local velocities can create different separation patterns and particle-impact locations.
The operating matrix should reflect actual service: minimum sustained flow, normal duty, maximum expected throughput, and any recurring transient condition. A process pump that spends hours throttled back deserves a different evaluation from one that briefly passes through low flow during startup. Duration matters when translating a local erosion tendency into maintenance risk.
Define speed, fluid density, viscosity, temperature, suction conditions, and solids loading before interpreting results. For viscous or non-Newtonian process fluids, a water-based model may misrepresent losses and separation. If cavitation is plausible, suction pressure and vapor pressure must also be represented; a single-phase calculation cannot establish cavitation erosion risk.
How to distinguish recirculation from an ordinary low-velocity region
Low velocity alone does not prove recirculation. A boundary layer, a stagnation point, and a separated pocket may all appear similar on a velocity-magnitude plot. Recirculation requires evidence of local flow reversal or a returning flow path relative to the intended throughflow.
Use velocity vectors, selected streamlines, and signed velocity components together. At the suction, negative axial velocity can reveal fluid moving back upstream. Inside the rotating impeller, relative velocity is usually more informative for blade-passage separation, while absolute velocity helps describe stationary-passage behavior. Mixing reference frames without explanation can make a legitimate flow structure look contradictory.
The geometry determines where to investigate:
- Impeller eye and blade leading edges: inspect for upstream reverse flow, incidence mismatch, and separation extending into the passages.
- Blade suction surfaces and passage exits: examine separated regions, uneven discharge, and wakes interacting with the casing.
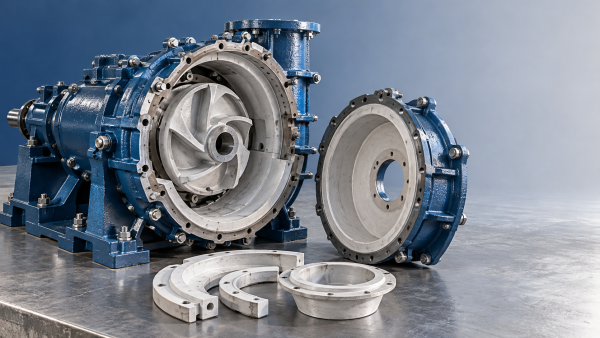
- Volute tongue and diffuser entrances: check for local separation, flow impingement, and pressure fluctuations caused by rotor–stator interaction.
- Wear-ring gaps, side chambers, and open-impeller tip clearances: investigate leakage jets and their mixing with the main flow.
A useful report quantifies the finding. Reverse-flow area or reverse mass flow through a defined plane can help compare operating points. State the plane location and sign convention, and distinguish gross reverse flow from net throughflow. Otherwise, two apparently comparable percentages may describe different quantities.
Steady streamlines also need care: they describe the computed steady field, not necessarily particle histories in a fluctuating flow. If a reverse-flow pocket changes substantially with rotor position, a time-averaged contour may conceal its peak extent.
Erosion risk follows impact conditions, not fluid speed alone
A high-speed liquid region is not automatically the most erosion-prone surface. For solid-particle erosion, the relevant combination includes particle impact velocity, impact angle, collision frequency, particle properties, and wall-material response. Particles have inertia; they do not necessarily follow curved liquid streamlines.
This distinction matters around blade leading edges and the volute tongue. A liquid streamline may turn smoothly while larger or denser particles continue toward a wall. Conversely, a recirculating pocket may retain particles and increase repeated impacts without containing the highest fluid velocity in the pump.
Particle tracking therefore needs a defensible inlet distribution, size distribution, density, and solids mass flow. A single representative diameter can hide a damaging coarse fraction. Particle shape and hardness also affect wear, although many practical models represent these effects only approximately through empirical coefficients.
Wall rebound assumptions deserve particular attention. A particle that rebounds from one blade may strike another surface downstream; changing the restitution model can relocate secondary hotspots. Turbulent dispersion and the number of tracked particle parcels can also influence predicted impact patterns, especially for smaller particles.
Dilute suspensions may permit one-way coupling, where the liquid influences particles without receiving significant feedback. Higher solids loading can require two-way coupling or a more suitable multiphase treatment. At sufficiently concentrated conditions, particle collisions and slurry rheology may invalidate a simple dilute tracking approach.
Treat an uncalibrated erosion map as a relative risk map, not a wall-life prediction. Empirical erosion correlations are sensitive to the material–particle combination and impact conditions used to develop them. Converting a modeled erosion rate into remaining service life requires validated material-loss behavior and a realistic exposure history.
Modeling choices that can move the hotspot
Geometry and boundary placement
Removing small gaps can simplify meshing but eliminate the leakage mechanism being investigated. Use clearances consistent with the assessment objective: nominal dimensions for a new design, measured or defensible worn dimensions for an existing pump. Include upstream disturbances when an elbow, reducer, or inadequate straight run is likely to affect inlet flow.
The inlet and outlet boundaries should be far enough from critical structures to avoid forcing an artificial solution. If inlet recirculation reaches the imposed inlet plane, extend the domain and check sensitivity. Setting a uniform inlet profile close to the impeller may suppress behavior that the analysis is intended to detect.
Steady versus transient calculations
A steady rotating-frame approach can be useful for screening operating points and comparing broad hydraulic trends. It is less persuasive when the decision depends on blade-passing fluctuations, intermittent separation, or the changing interaction between an impeller passage and the volute tongue.
A transient sliding-mesh calculation resolves relative rotor motion, but it still needs time-step sensitivity checks and sufficient simulated revolutions. Periodic behavior should be demonstrated through monitored quantities, rather than assumed after a fixed run duration. Some low-flow instabilities may require longer sampling than blade-passing behavior alone.
Mesh and turbulence treatment
Refine where gradients and impacts occur: leading edges, narrow gaps, the tongue, and separated shear layers. Near-wall resolution must match the turbulence model and wall treatment. No universal first-cell height or total cell count establishes adequacy for every pump.
More importantly, test the quantity that drives the decision. Head may change little between meshes while reverse-flow extent or local particle-impact density changes substantially. Local erosion peaks are particularly sensitive to wall-face size and particle sampling, so compare consistent surface regions as well as individual maximum values.
What makes the simulation credible enough to use?
Residual reduction is necessary evidence of numerical progress, but it is not validation. Check mass conservation, stability of head and torque, and convergence of the local indicators used to identify recirculation or wear. For transient results, report the averaging interval and fluctuation range.
Compare predicted hydraulic performance with test data at matching conditions. ISO 9906 provides a framework for hydraulic performance acceptance testing of rotodynamic pumps; it does not certify a CFD erosion prediction. Agreement in head, shaft power, and efficiency supports the hydraulic model, but does not independently validate every internal flow structure.
Local evidence is more discriminating. Measured pressure fluctuations can support an unsteady-flow assessment. Inspection records, thickness surveys, and documented wear locations can test whether predicted impact zones correspond to service damage. Comparisons should account for operating history, repaired surfaces, and changes in particle loading.
Do not label all observed material loss as particle erosion. Cavitation, corrosion, rubbing, and combined mechanisms can produce damage that requires different modeling and corrective action. A simulation that matches the location for the wrong physical reason is a weak basis for redesign.
Turn the findings into a decision, not just a contour plot
The corrective action should follow the mechanism. Persistent suction recirculation during throttled operation may justify reviewing pump selection, speed control, or the permitted operating range before changing blade geometry. A tongue hotspot associated with particle impingement may warrant geometry or material evaluation, but increasing tongue clearance can also alter hydraulic performance and pulsation behavior.
Likewise, reducing a leakage clearance may improve hydraulic efficiency while tightening manufacturing and maintenance tolerances. A geometry change that lowers peak predicted erosion at one operating point may simply move the impact zone elsewhere or worsen another duty condition. Recheck the operating envelope, not just the original hotspot.
The most useful Pump CFD Analysis ends with a traceable recommendation: the affected surface, the suspected mechanism, the operating conditions that trigger it, the sensitivity of the finding, and the evidence still needed. If the hotspot survives mesh, time-step, and particle-model checks, it is a reasonable target for inspection or design comparison. If it disappears when a weak assumption changes, resolve that uncertainty before committing to hardware.
Related Information
 Oct 26, 2026
Why Slurry Pump Bearing Assemblies Overheat After Replacement
Slurry Pump Bearing Assemblies overheating after replacement? Discover how lubrication, preload, and alignment affect heat—and learn practical checks to prevent costly downtime.- Oct 26, 2026
Pump CFD Analysis: Identifying Recirculation and Erosion-Prone Zones
Pump CFD Analysis reveals recirculation and erosion-prone zones. Learn how to validate hotspots, guide design improvements, and support more reliable pump operation.  Oct 25, 2026
Are Double-Casing Slurry Pumps Cheaper to Maintain Than Single-Casing?
Is a double-casing slurry pump cheaper to maintain than a single-casing pump? Compare wear life, parts, labor, and downtime to find the best value for your operation.- Oct 25, 2026
How Do You Free a Slurry Knife Gate Valve Stuck Partly Open?
How do I free a slurry knife gate valve stuck partly open? Discover safe isolation steps, approved flushing methods, and repair checks to restore reliable operation and reduce downtime.


{item.title}
Get a Quote
Please leave your information and email address, and we will contact you as soon as possible.